
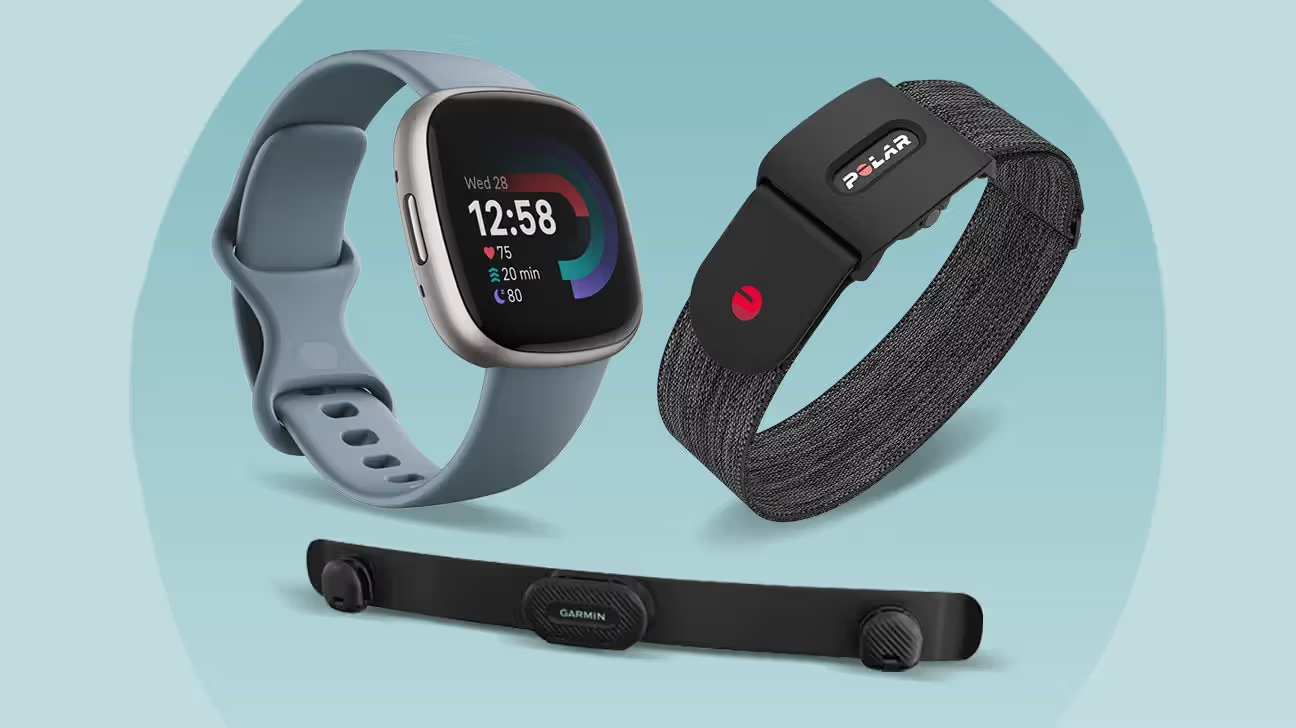
How to Use a Heart Rate Monitor for Effective Fat Burning Cardio
The Heart Rate Monitor: Your Precision Tool for Fat Loss Cardio
You have a heart rate monitor. Maybe it is a sleek watch or a simple chest strap. You see numbers flashing during your workout, but what do they actually mean for burning fat? The common advice is to “stay in the fat-burning zone,” yet that oversimplified concept often leads to frustration and stalled progress. The truth is your heart rate monitor is not just a calorie counter; it is a precision biofeedback device. When used correctly, it transforms vague exercise into targeted metabolic conditioning. This guide moves beyond theory to provide a tactical framework for using heart rate data to design, execute, and optimize cardio specifically for effective fat loss.
To use a heart rate monitor for fat burning, you must first identify your personal heart rate zones, not rely on generic formulas. The so-called “fat-burning zone” (typically 60-70% of your maximum heart rate) prioritizes fat as a fuel source during the exercise itself. Here’s the catch: for total fat loss, you must also consider the significant calorie burn and metabolic boost from higher-intensity work. The most effective strategy uses your monitor to periodize your training—spending dedicated blocks in lower zones to build metabolic efficiency and incorporating controlled high-intensity intervals to elevate total energy expenditure. Your device provides the objective data to ensure you are working at the intended intensity, track adaptations over time, and avoid the common pitfalls of overtraining or under-training.
This approach directly applies the intensity-matching strategy detailed in our parent guide, Cardio for Weight Loss: Effective Workouts, Exercises & Fat Burning Plans. Where that resource establishes the why, this article delivers the how—turning your monitor from a passive display into an active coaching tool.
Why Generic “Fat-Burning Zones” Are Incomplete
The allure of the fat-burning zone is understandable. It suggests a specific intensity where your body preferentially burns fat. Physiologically, this is accurate at a percentage level. At lower exercise intensities, a higher proportion of the energy you use comes from fat stores. As intensity increases, your body shifts to burning a greater proportion of carbohydrates for quick fuel. This has led to the pervasive idea that slow, steady cardio is optimal for fat loss.
This perspective, however, misses the critical factor of total energy expenditure. While the percentage of fat burned is higher at lower intensities, the total number of fat calories burned is often greater at moderate intensities because you are burning far more total calories. Consider a 30-minute session. In a low-intensity “fat-burning zone” workout, you might burn 200 calories, with 60% (120 calories) coming from fat. A moderate-intensity session might burn 350 calories, with only 40% from fat. That equals 140 fat calories—a higher absolute amount despite a lower percentage.
Also, focusing solely on the fat burned during the exercise window ignores the powerful afterburn effect, or Excess Post-exercise Oxygen Consumption (EPOC). Higher-intensity intervals create a larger metabolic disturbance, meaning your body burns extra calories for hours after your workout as it works to restore homeostasis. This post-exercise boost primarily draws from fat stores. Your heart rate monitor is key here, as it helps you quantify the intensity required to stimulate a meaningful EPOC without crossing into counterproductive overtraining.
As a result, the goal is not to live exclusively in one zone. It is to use your heart rate data to strategically move between zones, leveraging the unique benefits of each for comprehensive fat loss. This nuanced application is what separates effective, data-driven training from generic, one-size-fits-all advice.
Establishing Your Personal Heart Rate Foundation
Before you can train with zones, you must define them. Relying on the outdated “220 minus your age” formula for maximum heart rate (HRmax) introduces significant error, potentially misguiding your entire training plan by 10-15 beats per minute or more. For precise fat loss programming, you need personalized benchmarks.
Step 1: Determine Your Actual Maximum Heart Rate
The most accurate method is a graded exercise test under medical supervision, but a field test provides a reliable estimate. After a thorough warm-up, perform a sustained, high-intensity effort such as running or cycling uphill for 2-3 minutes, pushing to an absolute maximum sustainable effort in the final minute. The highest heart rate value you see on your monitor during this peak effort is a close approximation of your HRmax. Safety is paramount; this test is strenuous and should only be attempted by individuals with no cardiovascular risk factors.
Step 2: Identify Your Resting Heart Rate
Your resting heart rate (RHR) is a powerful indicator of cardiovascular fitness and recovery. Measure it first thing in the morning, before getting out of bed, for several consecutive days. The lowest consistent value is your true RHR. As your fitness improves from consistent cardio, your RHR will typically decrease—a positive adaptation your monitor can clearly track.
Step 3: Calculate Your Heart Rate Reserve
This is where precision is unlocked. The Heart Rate Reserve (HRR) method, also known as the Karvonen formula, accounts for your personal fitness level by incorporating your RHR. It is superior to using a simple percentage of HRmax.
The formula is: Heart Rate Reserve (HRR) = HRmax – RHR
You then calculate target zones by taking a percentage of your HRR and adding back your RHR. For example, to find the lower end of a 60-70% zone:
Target Heart Rate = (HRR x 0.60) + RHR
This method creates zones that are truly personalized. A fit individual with a low RHR will have different zone thresholds than a beginner with a higher RHR, even if they are the same age. This ensures both individuals are working at a metabolically equivalent relative intensity.
Defining Your Strategic Heart Rate Zones for Fat Loss
With your HRmax and RHR established, you can map your training landscape. Think of these zones not as rigid compartments, but as intensity domains with specific physiological purposes.
Zone 1: Recovery & Very Light (50-60% HRmax / <60% HRR)
This is active recovery. Conversation is easy. The primary purpose here is to promote blood flow and enhance recovery between harder sessions, not to drive fat loss directly. It supports consistency, which is the ultimate driver of results.
Zone 2: Aerobic / Base Building (60-70% HRmax / 60-70% HRR)
This is the classic “fat-burning zone.” Training here improves mitochondrial density and your muscles’ ability to oxidize fat for fuel. It builds metabolic efficiency—teaching your body to preserve glycogen and tap into fat stores. Sessions are long and conversational. This zone is the foundation of endurance and fat metabolism. For many, brisk walking, as explored in Is Walking Enough for Weight Loss? A Science-Based Guide for Beginners, falls squarely into this domain.
Zone 3: Tempo / Aerobic-Endurance (70-80% HRmax / 70-80% HRR)
This is the moderate-intensity sweet spot for total calorie burn. Breathing becomes more rhythmic but controlled. You are burning a mix of fat and carbohydrates at a high total rate. This zone improves your lactate threshold, allowing you to work harder before fatigue sets in. It is highly effective for fat loss due to the significant energy expenditure.
Zone 4: Threshold / Hard (80-90% HRmax / 80-90% HRR)
Exercise here is challenging. Breathing is deep and forceful. You are operating at or near your lactate threshold, where lactate production exceeds clearance. This zone dramatically increases calorie burn and stimulates a substantial EPOC. Work here is typically done in intervals (e.g., 4-minute efforts) with recovery periods.
Zone 5: Maximum / All-Out (90-100% HRmax / 90-100% HRR)
This is maximum effort, sustainable only for short bursts (e.g., 30 seconds to 1 minute). It maximizes EPOC and improves anaerobic power. While the session calorie burn may be lower due to short duration, the metabolic aftershock is significant.
For fat loss, Zones 2, 3, and 4 are your primary tools. Zone 2 builds the metabolic engine, Zone 3 burns a high volume of calories, and Zone 4 (via intervals) provides the metabolic spark. Your monitor tells you exactly which domain you are in at all times.
Periodization: The Blueprint for Intelligent Fat Loss Training
Random workouts yield random results. Periodization is the systematic planning of training variables—intensity, volume, and frequency—over time to maximize adaptation and avoid plateaus. Your heart rate monitor is the execution tool for this plan.
Phase 1: Base Building (Weeks 1-4)
Focus: Develop aerobic efficiency and fat adaptation.
Monitor Guidance: Spend 80% of your cardio time in Zone 2. Use your monitor to resist the urge to go faster. If your heart rate drifts above the zone on a steady effort, slow down. The goal is metabolic conditioning, not fatigue.
Example: Three 45-minute sessions per week, keeping heart rate firmly between 60-70% HRmax (or 60-70% HRR).
Phase 2: Intensity Introduction (Weeks 5-8)
Focus: Increase total calorie burn and metabolic rate.
Monitor Guidance: Introduce one weekly session of intervals. Perform a workout like 5 x 3-minute efforts in Zone 4 (88-92% HRmax), with 3-minute active recovery in Zone 1-2. Your monitor ensures you hit the correct peak intensity and recover adequately between intervals.
Supporting Sessions: Maintain two Zone 2-3 steady-state sessions.
Phase 3: Metabolic Integration (Weeks 9-12)
Focus: Maximize fat loss through combined intensity and volume.
Monitor Guidance: Implement a mixed-week strategy. Example: One long Zone 2 session (60+ mins), one Zone 3 tempo session (30-40 mins), and one high-intensity interval training (HIIT) session in Zones 4/5. Your monitor provides immediate feedback to stay on target for each distinct workout type. For more on structuring these combined approaches, see How to Combine HIIT and Steady-State Cardio for Optimal Results.
This periodized approach, guided by heart rate, prevents adaptation, manages fatigue, and systematically attacks fat loss from multiple physiological angles. It is the antithesis of doing the same moderate-intensity workout every day, which often leads to diminishing returns.
Advanced Tactics: Using Heart Rate Data Beyond the Workout
The value of your monitor extends far beyond the workout screen. The data it collects creates a longitudinal picture of your physiology.
Tracking Heart Rate Drift (Cardiovascular Drift)
During a long, steady-paced workout in a warm environment, you may notice your heart rate gradually creeping upward even though your perceived effort and pace feel constant. This is heart rate drift, caused by increased core temperature and reduced blood plasma volume. A significant drift (e.g., 10-15 bpm over 45 minutes) can indicate dehydration, poor fitness, or excessive heat stress. It signals that your body is working harder to maintain the same output, meaning your Zone 2 session has unintentionally drifted into Zone 3. Noting this helps you adjust hydration, pacing, or cooling strategies.
Monitoring Recovery: Heart Rate Variability (HRV)
Many modern monitors estimate Heart Rate Variability—the variation in time between successive heartbeats. A higher HRV generally indicates a well-recovered and resilient nervous system, while a lower HRV can signal stress, fatigue, or impending illness. Tracking your HRV trend each morning can inform daily decisions. If your HRV is significantly lower than your baseline, it may be wise to switch a planned high-intensity session to a Zone 1 recovery day, preventing overtraining and supporting long-term consistency.
Analyzing Workout Load and Trends
Use your device’s companion app to review weekly and monthly trends. Are you spending more time in higher zones without an increase in perceived effort? This indicates improved fitness. Is your average heart rate for the same pace decreasing? That is a clear sign of increased efficiency. This objective feedback is motivating and confirms your strategy is working, as discussed in the broader context of tracking progress in our guide on How to Calculate Your Cardio Calorie Burn for Weight Loss Goals.
Selecting and Using Your Heart Rate Monitor Technology
Not all heart rate monitors are created equal. The right tool depends on your need for accuracy and convenience.
| Feature | Chest Strap Monitor | Optical Wrist Monitor (Watch/Fitness Band) |
|---|---|---|
| Core Technology | Electrocardiogram (ECG) – measures electrical activity of the heart. | Photoplethysmography (PPG) – uses light to detect blood flow changes. |
| Accuracy | Very High. Gold standard for dynamic, rapid heart rate changes. | Good to Moderate. Can lag during rapid intensity changes. May be affected by motion, skin tone, and fit. |
| Best For | Interval training, HIIT, precise zone training, and users who prioritize data accuracy. | General fitness tracking, daily activity, steady-state cardio, and 24/7 wear convenience. |
| Comfort & Convenience | Requires a strap; some find it intrusive. Must be moistened for contact. | Very convenient; worn like a watch. No extra steps required. |
| Heart Rate Variability | Typically provides more accurate HRV readings due to ECG signal. | HRV estimates can be reliable for trend analysis if taken at consistent rest (e.g., morning). |
Recommendation for Fat Loss Training: For the serious trainee following a periodized plan with intervals, a chest strap is the superior tool. Its accuracy during rapid transitions ensures your Zone 4 intervals are truly in Zone 4, and your recovery is complete. For those focused primarily on Zone 2-3 steady-state work, a quality optical wrist monitor is sufficient and more convenient.
Regardless of type, proper use is critical. A chest strap must be snug and positioned correctly. An optical sensor must be worn snugly above the wrist bone, not too tight. For the most accurate calorie estimates, ensure your monitor’s profile (age, weight, height) is up to date.
Integrating Heart Rate Training with Nutrition and Recovery
Heart rate-monitored cardio does not operate in a vacuum. It is one component of the fat loss equation, synergizing with nutrition and recovery.
Nutritional Synchronization
Low-Intensity (Zone 2) Sessions: These can be performed in a fasted state (e.g., morning before breakfast) to potentially enhance fat oxidation, as glycogen stores are slightly lower. Ensure you are hydrated.
High-Intensity (Zone 4/5) Sessions: These require adequate carbohydrate availability for performance. Attempting a HIIT session in a fasted or low-carb state will be difficult, and your heart rate data will show it—you will struggle to reach target zones, and performance will plummet.
Post-Workout: While heart rate data does not dictate meal timing, the higher the intensity and duration, the more important post-workout nutrition becomes for recovery, especially if you train daily.
Recovery as a Data Point
Your heart rate monitor provides direct recovery metrics. A resting heart rate that is elevated by 7-10 bpm above your normal morning average can be a sign of incomplete recovery, residual fatigue, or onset of illness. Similarly, a consistently depressed HRV trend is a red flag. This data should prompt action: prioritize sleep, manage life stress, hydrate, and consider reducing training intensity. Forcing high-intensity work when your body is signaling fatigue increases injury risk and undermines fat loss by elevating stress hormones like cortisol.
This holistic view aligns with the balanced approach advocated when comparing modalities, as seen in Cardio vs. Strength Training for Fat Loss: The Best Balance. Both cardio and strength training impose stress that must be managed through recovery, which your heart rate can help you monitor.
Troubleshooting Common Heart Rate Monitor Issues
Even with the best device, you may encounter data anomalies. Understanding them prevents misinterpretation.
Cadence Lock (Optical Monitors): The device locks onto your step or stride rate instead of your heart rate. This is common in rhythmic activities like running or cycling. You will see a heart rate that is suspiciously steady and matches your cadence. Solution: Ensure the watch is snug, worn 1-2 finger widths above the wrist bone, and not over a tattoo. Sometimes pausing and restarting the workout can help.
Signal Dropout (Chest Straps): The heart rate signal disappears or becomes erratic. This is usually due to a dry electrode or a low battery. Moisten the electrode area with water or electrode gel before putting on the strap. Replace the battery annually.
Inaccurate High Readings at Rest: An optical sensor may give falsely high readings if you are moving your arms (e.g., brushing teeth, cooking). For true resting measurements, sit still for one full minute and observe the stabilized reading.
Slow Response to Interval Efforts: Optical sensors have a inherent lag of 5-15 seconds compared to ECG straps. Do not expect your wrist-based heart rate to instantly spike at the start of a sprint; it will catch up. For interval work, perceived exertion is a crucial immediate guide, with heart rate confirming the effort post-interval.
Building Your First Four-Week Heart Rate Based Plan
Here is a practical, executable four-week starter plan. It assumes you have determined your personal heart rate zones using the HRR method.
Weekly Schedule:
Day 1: Steady-State (Zone 2-3)
Day 2: Active Recovery (Zone 1) or Rest
Day 3: Interval Training
Day 4: Steady-State (Zone 2)
Day 5: Rest
Day 6: Long, Slow Distance (Zone 2)
Day 7: Rest or Gentle Mobility
Week 1-2: Foundation
Steady-State (Day 1 & 4): 30 minutes. Warm up 5 mins in Zone 1. Maintain 25 mins in Zone 2 (60-70% HRR). Use your monitor to pace yourself. If heart rate climbs, slow down.
Interval (Day 3): 25 minutes total. Warm up 5 mins in Zone 1-2. Perform 6 x 1-minute efforts at a hard pace (aiming for Zone 4, 80-85% HRmax). Between each, recover with 2 minutes of very easy walking (Zone 1). Cool down 5 mins.
Long Session (Day 6): 40 minutes entirely in Zone 2. Focus on holding a steady heart rate.
Week 3-4: Progression
Steady-State (Day 1): Increase to 35 mins, with the final 10 mins allowed to drift into low Zone 3.
Steady-State (Day 4): Maintain 30 mins in Zone 2.
Interval (Day 3): Progress to 8 x 1-minute efforts. Keep recovery at 2 minutes.
* Long Session (Day 6): Extend to 50 minutes in Zone 2.
This plan balances stress and recovery, uses multiple heart rate zones, and provides clear progression—all guided by the objective data on your wrist or chest.
Conclusion: From Data to Results
A heart rate monitor’s greatest value is turning subjective feeling into objective fact. It replaces “I think I worked hard” with “I spent 22 minutes in Zone 4 and my average heart rate was 162.” This objectivity eliminates guesswork and emotional judgment from your training. It allows you to execute a periodized fat loss strategy with precision, ensuring you are providing the correct physiological stimulus at the correct time.
The path to effective fat burning cardio is not about finding one magic zone and staying there. It is about intelligently varying intensity to challenge your energy systems, boost your metabolism, and build a more efficient fat-burning engine. Your heart rate monitor is the dashboard for this entire process. By personalizing your zones, periodizing your training, and listening to the data for recovery insights, you transform cardio from a chore into a targeted, results-driven science.
Begin by establishing your true Heart Rate Reserve. Then, design your first week using the zones defined by that calculation. For the comprehensive framework on how this tactical tool fits into your overall weight loss strategy, always refer back to the master plan in Cardio for Weight Loss: Effective Workouts, Exercises & Fat Burning Plans. Your monitor provides the numbers; this knowledge provides the strategy. Now, execute.
Frequently Asked Questions
What is the most accurate way to find my fat-burning zone?
The most accurate method uses your Heart Rate Reserve (HRR). Calculate your HRR by subtracting your Resting Heart Rate from your Maximum Heart Rate. Your target zone is typically 60-70% of that HRR, plus your Resting Heart Rate. This personalizes the zone far better than generic age-based formulas.
Can I use a smartwatch for heart rate zone training, or do I need a chest strap?
You can use a quality smartwatch with an optical sensor, especially for steady-state cardio in Zones 2 and 3. Still, for high-intensity interval training where rapid heart rate changes occur, a chest strap (ECG) is significantly more accurate. It responds faster with less lag, ensuring your interval efforts are correctly measured.
Why does my heart rate stay high even after I stop exercising?
This is normal and part of the Excess Post-exercise Oxygen Consumption (EPOC) effect. After intense exercise, your body works to restore oxygen levels, repair tissues, and clear metabolic byproducts like lactate. This process requires energy, which keeps your heart rate and metabolism elevated, contributing to additional calorie and fat burn.
My heart rate is higher than normal for my usual easy run. What does this mean?
An elevated heart rate at a familiar, easy pace is a classic sign of fatigue or incomplete recovery. Potential causes include accumulated training stress, dehydration, poor sleep, elevated life stress, or the onset of an illness. Treat this as a signal to prioritize recovery—opt for a lighter workout or a full rest day.
References
– American Heart Association Recommendations for Physical Activity in Adults
– Mayo Clinic: Exercise intensity: How to measure it
– Centers for Disease Control and Prevention: Target Heart Rate and Estimated Maximum Heart Rate
– National Academy of Sports Medicine: The Science of Fat Loss
– PubMed Central: Methods to Determine the Intensity of Physical Activity